
Development of the 4 Most Dense
Urbanized Areas in the USA: 1950-2000
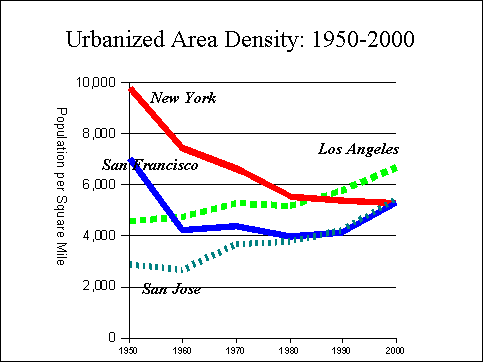
Los Angeles has
extended its lead as the nation’s most dense urban area, at 7,068 per square
mile in 2000. Further, the new data indicates that Los Angeles is the most
dense urban area north of the Mexican border, with Toronto having fallen to
second place, at 6,835 (Statistics Canada and the US Census Bureau use similar
criteria for urban/urbanized areas).
Historically
Comparable Urban Areas (HCUA) Analysis: Adjusting for urbanized area
definitional changes to make the 2000 data more comparable with 1990 and
before, the Historically Comparable Urban Area (HCUA) of Los Angeles is now 27
percent more dense than New York, up from seven percent in 1990 and minus seven
percent in 1980.
The New York HCUA has declined 46 percent from its 1950
density, though has dropped less than five percent in the last 20 years.
Nonetheless, at nearly 3,353 square miles, New York
is by far the world’s most sprawling urban area (Chicago,
at 2,123 square miles appears to be second). The New York HCUA is now 5,309
persons per square mile.
The San Francisco HCUA has fallen 25 percent since 1950,
when it was slightly more dense than Los
Angeles in 2000. However, San
Francisco fell 43 percent from 1950 to 1980, but has
since recovered approximately 40 percent of that loss. The San Francisco HCUA is
now 5,298 persons per square mile and ranks as the nation’s fourth most dense
urbanized area.
The San Jose HCUA, which it could be argued should be a part
of the San Francisco urbanized
area, has grown very rapidly and is now nearly 90 percent more dense than in
1950. San Jose is unique in not
having a strong urban
core and being virtually all suburban (automobile oriented) in design, owing to
the fact that almost all of its development occurred after World War II. The San
Jose HCUA has a density of 5,439 persons per square mile and ranks as the
nation’s second most dense urbanized area.
|
HISTORICALLY COMPARABLE URBAN AREAS |
|
Population per Square Mile |
|
|
|
Year |
Los Angeles |
New York |
San Francisco |
San Jose |
|
1950 |
4,589 |
9,813 |
7,045 |
2,885 |
|
1960 |
4,736 |
7,460 |
4,250 |
2,704 |
|
1970 |
5,312 |
6,683 |
4,388 |
3,700 |
|
1980 |
5,188 |
5,552 |
4,009 |
3,816 |
|
1990 |
5,800 |
5,407 |
4,153 |
4,246 |
|
2000 |
6,720 |
5,309 |
5,298 |
5,439 |
|
|
|
|
|
|
|
2000 area adjusted to improve comparability to 1990 definition. |
|
|
|
|
|
|
|
Change from 1950 |
|
|
|
|
Year |
Los Angeles |
New York |
San Francisco |
San Jose |
|
1950 |
0.0% |
0.0% |
0.0% |
0.0% |
|
1960 |
3.2% |
-24.0% |
-39.7% |
-6.3% |
|
1970 |
15.8% |
-31.9% |
-37.7% |
28.3% |
|
1980 |
13.1% |
-43.4% |
-43.1% |
32.3% |
|
1990 |
26.4% |
-44.9% |
-41.0% |
47.1% |
|
2000 |
46.4% |
-45.9% |
-24.8% |
88.5% |
|
|
|
|
|
|
|
Compiled by Demographia from US Census Bureau data. |
Demographia is Affiliated with The Public Purpose, A Top National Journal Internet Site
Demographia is "pro-choice" with respect to urban development.
People should have the freedom to live and work
where and how they like.
|
DEMOGRAPHIA
and THE PUBLIC PURPOSE
are undertakings of
WENDELL COX CONSULTANCY
P. O. Box 841 - Belleville, IL 62222 USA
Telephone: +1.618.632.8507 -
Facsimile: +1.775.521.8564
Send E-Mail
(c) 2001 www.demographia.com --- Wendell Cox Consultancy --- Permission granted to use with attribution.
|
|